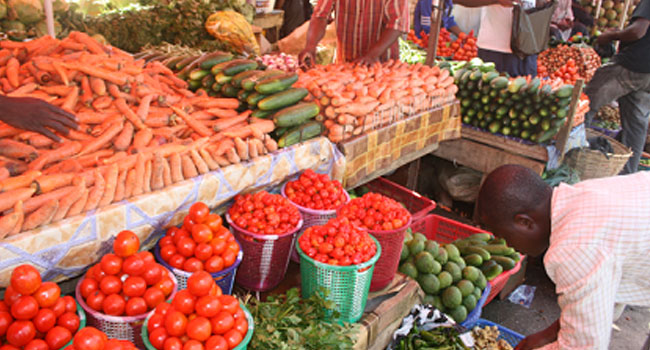
The demand for Consumption goods increased to US$618.06 million at the end of the first quarter of the year 2020 from US$540.09 million in the corresponding quarter of 2019.
This increase of US$77.97 million in the past one year represents a year-on-year growth of 14.4 percent.
This is according to the second quarter bulletin released by the Bank of Ghana.
The increase in demand for consumption goods, according to the Bank of Ghana, was as a result of a high demand for goods in all sub-categories, except for primary foods and beverages mainly for household consumption.
The value of intermediate goods imported decreased by 4.7 percent to US$1,432.11 million. This was attributed largely to a fall in the demand for goods in all sub-categories except processed industrial supplies, which recorded an increase of 6.4 percent.
The Bank of Ghana noted that the value of capital goods imported during the second quarter of 2020 amounted to US$618.57 million, up by 26.71 percent from the US$488.18 million recorded for the same quarter in 2019.
This was attributed to a 34.1 percent and 96.6 percent increase in capital goods (except transport) and industrial transport goods respectively.
Still on imports, the Bank of Ghana stated that the value of ‘other goods’ imports totaled US$312.63 million at the end of June this year, up from the US$183.55 million imported during the end of the second quarter of 2019. This in percentage terms, culminated into a 70.3 percent increase over the one-year period.

The central bank said this was mainly due to an increase in demand for passenger cars.
However, the share of capital and intermediate goods in non-oil imports during the period declined from 73.3 percent to 68.8 percent.
The first six months of the year also saw a decline in the country’s imports of electricity as compared to the correcting period in the previous year.
“During the period, 16,460,592 kWh of electricity valued at US$1.98 million was imported by VRA compared to 31,227,200 kWh worth US$3.75 million, imported during the same period in 2019”.
Top Ten Major Non-Oil Imports
The central bank further stated that the total value of the top ten non-oil merchandise imports for the second quarter of 2020 amounted to US$868.25 million, compared to US$621.62 million recorded a year ago.
The major non-oil imports that drove this increment during the quarter under review were motor vehicles for the transport of persons and goods, self-propelled bulldozers, herbicides, insecticides and fungicides, rice, fertilizers, cereal grains, and polyethylene.
Merchandised Non–Oil Imports
These developments in the country’s import dynamics in the first six months of the year, put the total merchandise non-oil imports for the second quarter of 2020 at US$2,991.10 million (including electricity imports) compared to an outturn of US$2,718.97 million recorded for the same period in 2019. This represents a 10 percentage point increment over the past one year.
The Bank of Ghana attributed the general expansion in the countries merchandise non-oil imports in the first six months of 2020 to decreases in all the major categories except Intermediate goods.
Sources of Merchandise Imports
To make a holistic analyses of the country’s imports in the first six months of the year, the central bank provided the countries from which Ghana obtained its imported goods and services.
According to the central bank, the Far East emerged as the leading source of imports in the period under review, accounting for 33.4 percent of the total imports.
The European Union followed with a share of 21.9 percent, Other Economies (20.2%), North America (9.8%), Other Europe (7.2%), ECOWAS (3.8%), and the Rest of Africa (3.6%).


