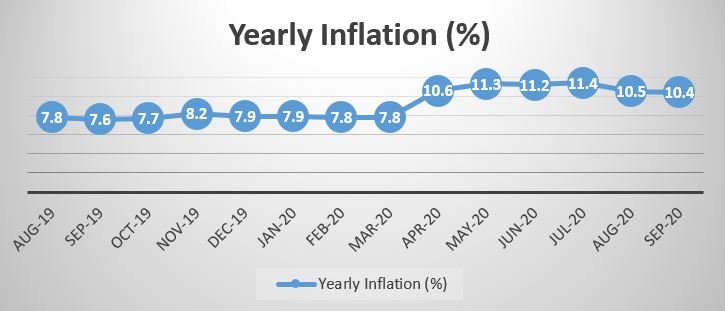
The national year-on-year inflation rate dropped from 10.5% in August to 10.4% in September 2020, which is 0.1 percentage points lower than last month, according to the latest CPI report released today by Ghana Statistical service (GSS).
This is an indication that actual prices decreased marginally last month.
Month-on-month inflation between August 2020 and September 2020 was 0.2 percent.
The Food and Non-Alcoholic Beverages Division recorded a year-on-year inflation rate of 11.2%. This is 0.2 percentage point lower than the 11.4% recorded in August 2020.
According to the GSS, the marginal decline in inflation in September stands in contrast to the average 0.9% month-on-month inflation that was recorded during the months April to July 2020 and the average month-on-month inflation rate of 0.7% that was recorded in the six months prior to COVID-19.
The GSS indicated that, only two of the thirteen Divisions had higher than average inflation rates; Housing, Water, Electricity and Gas (20.3%) and Food and Non-Alcoholic Beverages (11.2%). Details of the year-on-year inflation for past 14 months have been displayed in figure 1.
Figure 1: Consumer Price Indices, August 2019 to September 2020.

Source: Ghana Statistical service
Regional Inflation
Regional analyses revealed that, the overall year-on-year inflation ranged from 1.3% in the Upper West Region to 14.2% in Greater Accra. In July, the overall year-on-year inflation ranged from 4.7% in the Volta Region to 13.6% in Greater Accra.
According to the GSS, when separating inflation in to Food and Non-Food inflation, it is clear that Greater Accra had a lower Food inflation (10.3%) than Non-Food inflation (17.2%). In contrast, Ashanti Region recorded the highest Food inflation (19.5%), but a relatively low Non-Food inflation (5.2%).
The highest overall month-on-month inflation of 0.1% was recorded in the Volta Region. All regions with the exception of Greater Accra showed a negative month-on-month Food Inflation.
Food and Non-Food Inflation
The report shows that, in August 2020, food contributed 47.6% to the total inflation and thus is still the predominant driver of year-on-year inflation. “This percentage is, again, lower than the previous months and comparable to the contribution levels of Food to total inflation prior to COVID-19.
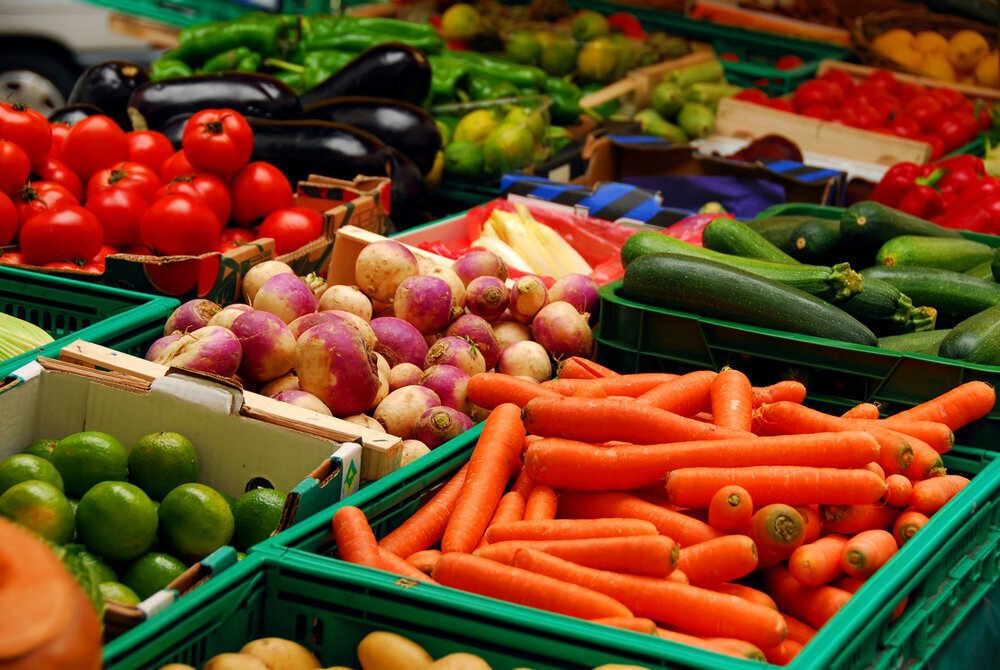
“The Food and Non-Alcoholic Beverages Division recorded a year-on-year inflation rate of 11.2%. This is 0.2 percentage point lower than in August 2020 (11.4%). Within the Food Division, Vegetables (18.9%) was the Subclass with the highest rates of inflation. This is lower than in the previous months. In contrast, month-on-month Food inflation was -.5%, with -3.9% for the Vegetables Subclass”, GSS said.

On the other hand, year-on-year Non-Food inflation in the month of September was 9.8%, which is lower than the 9.9% measured in August 2020. On month-on month basis, non-food inflation was 0.1%, which is lower than the 0.2% measured in August 2020, GSS added.
The GSS further stated that, “Health, Restaurants and Accommodation Services and Information and Communication, were three Divisions that recorded higher month-on-month inflation rates between August and September 2020 than on average during the months April to July 2020 and before COVID-19.
“The Non-Food Subclasses with the lowest inflation were Life and Accident Insurance (-14.4%), Electricity (-35.5%) and Electric Appliances for Personal Care (-66.4%). On the other side, the Non-Food Subclasses with the highest inflation were Refuse collection (49.6%), rents (40.1%) and Vehicle Maintenance and Drivers Lessons (34.1%)”.
Imported and Local Inflation
According to the report, the inflation of imported goods was 5.1%, while the inflation of local goods was 12.3% on average. Month-on-month inflation for imported goods was 0.4%, while month-on-month inflation for local goods was -0.5%.
The main contributor to negative local inflation, according to the GSS, “was the inflation of locally produced foods”.


